Statistical Analysis with Excel For Dummies
by Schmuller, Joseph- List Price: $29.99
- ISBN-10: 0470454067
- ISBN-13: 9780470454060
- Edition: 2nd
- Type: Paperback
- Publisher: For Dummies
About The Book
You too can understand the statistics of life, even if you're math-challenged! What do you need to calculate? Manufacturing output? A curve for test... Read more
Related Books

- Year: -0001
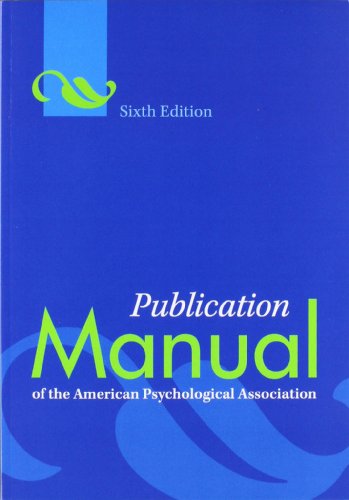
- Edition: Sixth
- Publisher: American Psychological Association
- Type: Spiral-bound
- ISBN13: 9781433805622
- ISBN: 1433805626

- Year: 2001
- Edition: 7th
- Publisher: Pearson
- Type: Paperback
- ISBN13: 9780137001149
- ISBN: 0137001142

- Year: -0001
- Edition: 6th
- Publisher: American Psychological Association
- Type: Paperback
- ISBN13: 9781433805615
- ISBN: 1433950618
